Once ParseHub has collected the data you need, it is time to analyze your results. For many cases, using the tools in Microsoft Excel or a similar spreadsheet program will be more than capable of analyzing the CSV file that ParseHub gives you. However, if you are finding yourself limited by the capabilities of your spreadsheet program, you may need to write a program using the data analysis language of your choice. If you have never written in a data analysis language before, this tutorial will give you everything you need to start analyzing your JSON file with the popular and open source language of Python. If you are already familiar with Python and have your own preferred Python Editor, you can skip the introductory section and start reading the section "Importing JSON Files".
Starting Python
At ParseHub, we use the free and easy-to-use Jupyter Notebooks, formerly called iPython Notebooks, to run our JSON data analysis. If you install the bundle Anaconda by following this link, you will automatically install Python, the Notebooks, and other popular data science packages that may help with your analysis.
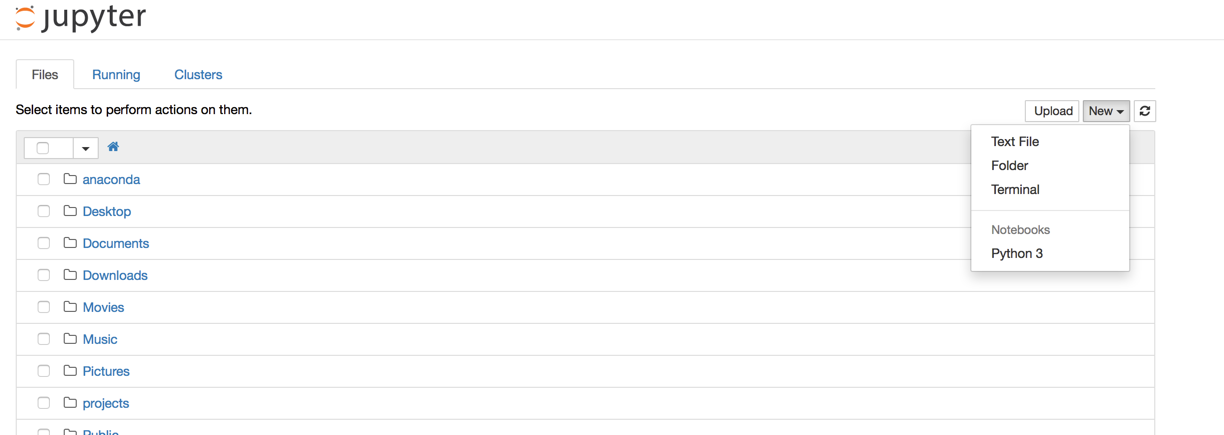
You can follow these instructions to launch your Notebook for the first time. Going to "New" in the top right corner will give you a drop down menu. Select "Python 3" and you will be ready to start writing your code. Familiarize yourself with Python by taking one of the many free online courses that are available.

Importing JSON Files
Manipulating the JSON is done using the Python Data Analysis Library, called pandas. Import pandas at the start of your code with the command:
import pandas as pd
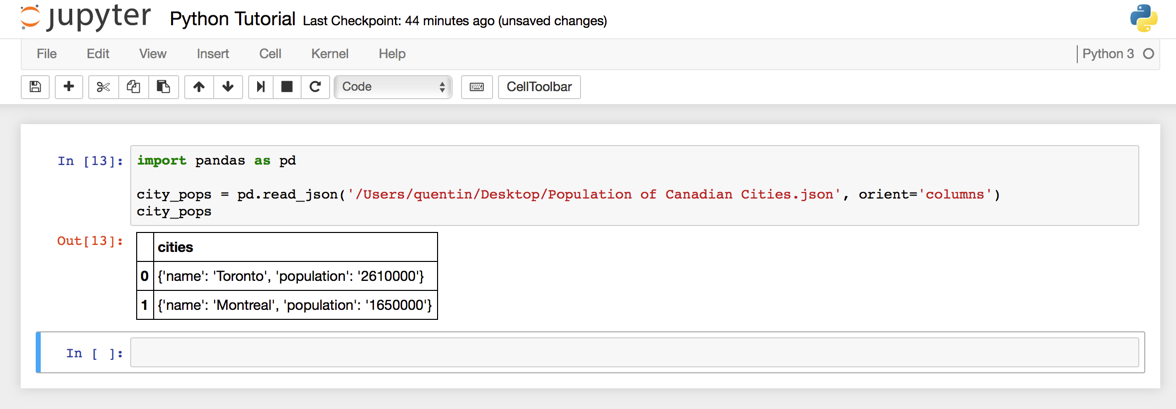
Now you can read the JSON and save it as a pandas data structure, using the command read_json.
The path parameter of the read_json command can be a string of JSON i.e. {"cities":[{"name":"Toronto", "population":"2.61 million"}, {"name":"Montreal", "population":"1.65 million"}]} but for our projects we will more likely be using the name and location of the JSON file that contains your ParseHub results. You can see an example of this in the image below, where I have saved the data on my desktop.

You can see that I have added another parameter to the read_json command: orient. you may have to change this parameter depending on how your JSON is structured. The list of all the parameters can be found in the read_json documentation.
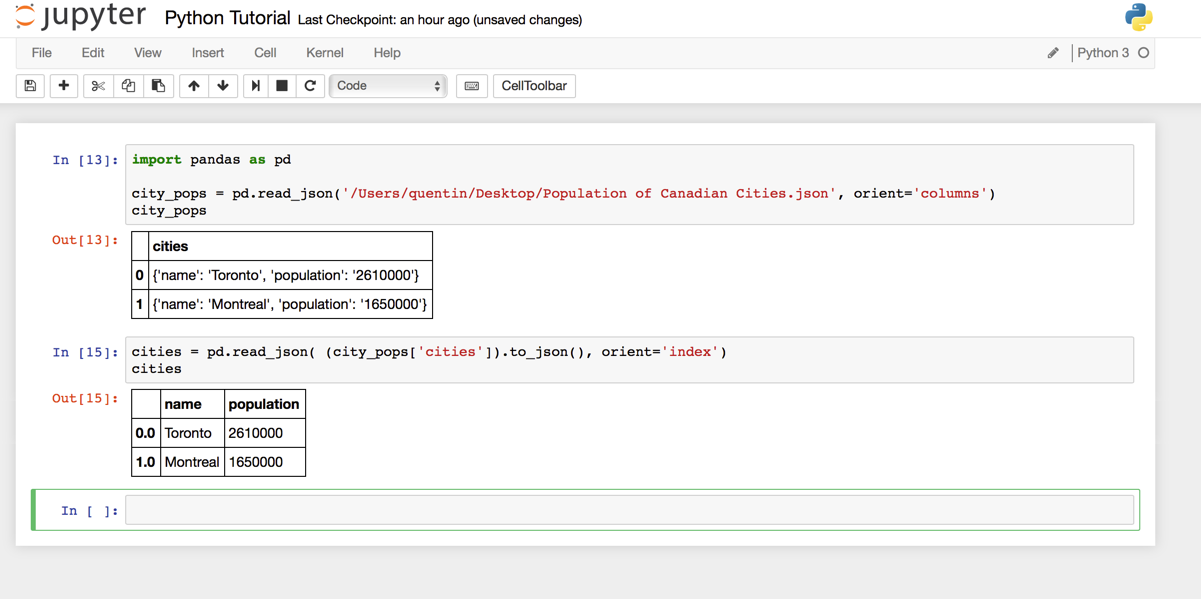
Finally, you will notice in the output that the names and the populations of the cities are not in their own separate columns. They are entered as strings that can be read as JSON objects of their own, though. To separate them properly, we must select the column named "cities", convert it to JSON and then read it like earlier.
Converting a string to JSON is done with the function to_json(), and selecting a column of a pandas data frame is done with the following syntax:
dataframe_name['column_name']
More helpful pandas syntax can be found in their Intro to Data Structures documentation. In the image below you can see the result of reading the column.

Manipulating JSON With Python
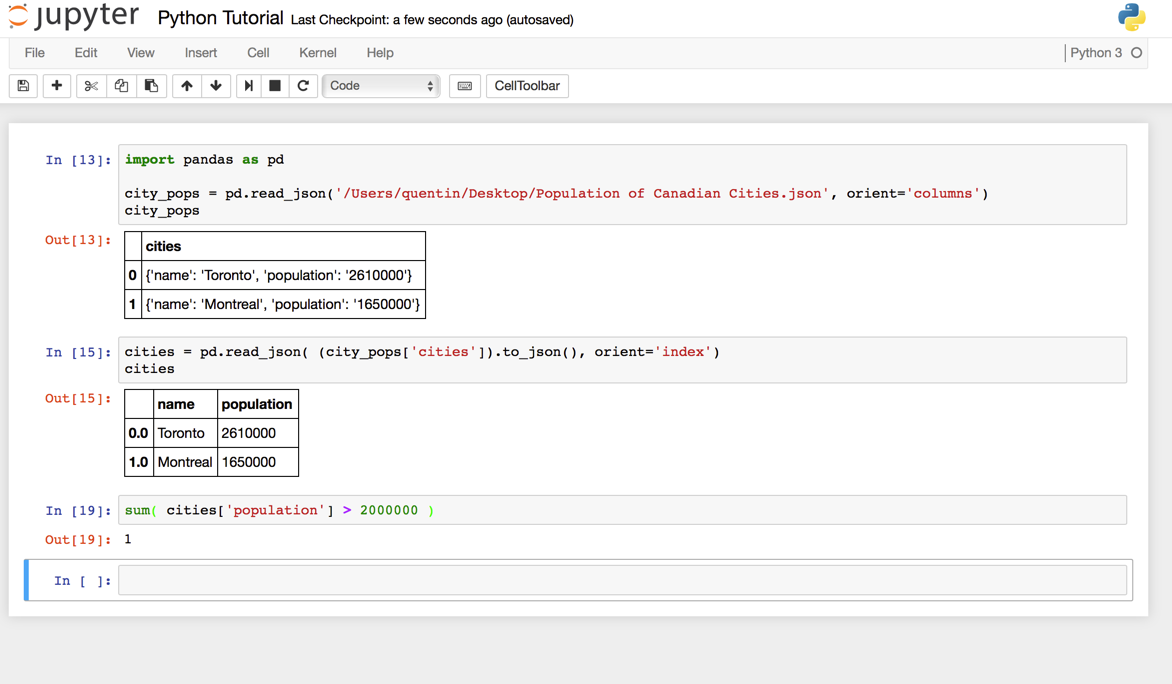
Once you are comfortable with Python and these few pandas commands, you can start to analyze the data that you scraped from the web. A simple example is to filter the cities by population. In the image below, I have counted the number of cities that have a population greater than 2 million.

This is a very simple example, but programming will allow for much more complex analysis than excel with large sets of data.
